Dew Point Uncertainty: When a Positive Surface Margin Spans Zero
A calculated dew point of 11.09°C looks precise. If the measured surface is at 12.00°C, subtracting the two suggests a comfortable positive margin. But the digits describe the calculation; they do not describe how well the underlying temperatures and humidity are known.
For a condensation check, the useful output is often a bounded margin with an explicit interpretation. This walkthrough builds one from a small, invented dataset. It does not describe a real installation, claim a sensor's published accuracy, or prescribe a universal control setpoint.
Define the measurements before calculating
Consider room air near a cold pipe. Use Celsius for both air and surface temperature, and express relative humidity in percent. Assume the air reading represents the air contacting the measured surface. That assumption is essential: a room sensor several metres away may describe a different moisture condition.
| Quantity | Nominal reading | Assumed bound |
|---|---|---|
| Air temperature | 22.0°C | ±0.3°C |
| Relative humidity | 50% | ±3 percentage points |
| Surface temperature | 12.0°C | ±0.5°C |
The humidity interval is 47% to 53%. It is not 48.5% to 51.5%, which would result from applying a relative 3% change to the displayed value. Writing “percentage points” prevents that ambiguity before it enters a spreadsheet or a function call.
These are assumed hard bounds for a demonstration. They are not standard uncertainties, a 95% confidence statement, or specifications for every sensor. For a real instrument, read how its manufacturer states accuracy, the environmental conditions covered, and whether calibration, drift and installation effects are included.
Use one formula consistently
For this above-freezing example, use the liquid-water Magnus coefficients 17.62 and 243.12°C shown in the WMO humidity training material, page 13. The calculation is approximate. A more complete physical model can include effects omitted from this simple expression.
Let T be air temperature and RH be relative humidity in percent:
gamma = ln(RH / 100) + 17.62 × T / (243.12 + T)
Td = 243.12 × gamma / (17.62 − gamma)
At 22°C and 50% RH, this gives Td = 11.0946°C. Define the surface margin as M = Ts − Td, where Ts is the surface temperature. The nominal margin is therefore 12 − 11.0946 = +0.9054°C.
Do not substitute air temperature for surface temperature in this subtraction. Air temperature minus dew point is dew-point depression. It answers a different question and cannot tell you whether the pipe surface is above the condensation threshold.
Propagate the stated bounds
Within the temperature and humidity range used here, calculated dew point increases as either input increases. That monotonic behaviour makes the bounding calculation simple: evaluate the low-temperature, low-humidity corner for the lowest dew point, and the high-temperature, high-humidity corner for the highest.
| Evaluation | Air temperature | RH | Calculated dew point |
|---|---|---|---|
| Lower bound | 21.7°C | 47% | 9.89°C |
| Nominal | 22.0°C | 50% | 11.09°C |
| Upper bound | 22.3°C | 53% | 12.25°C |
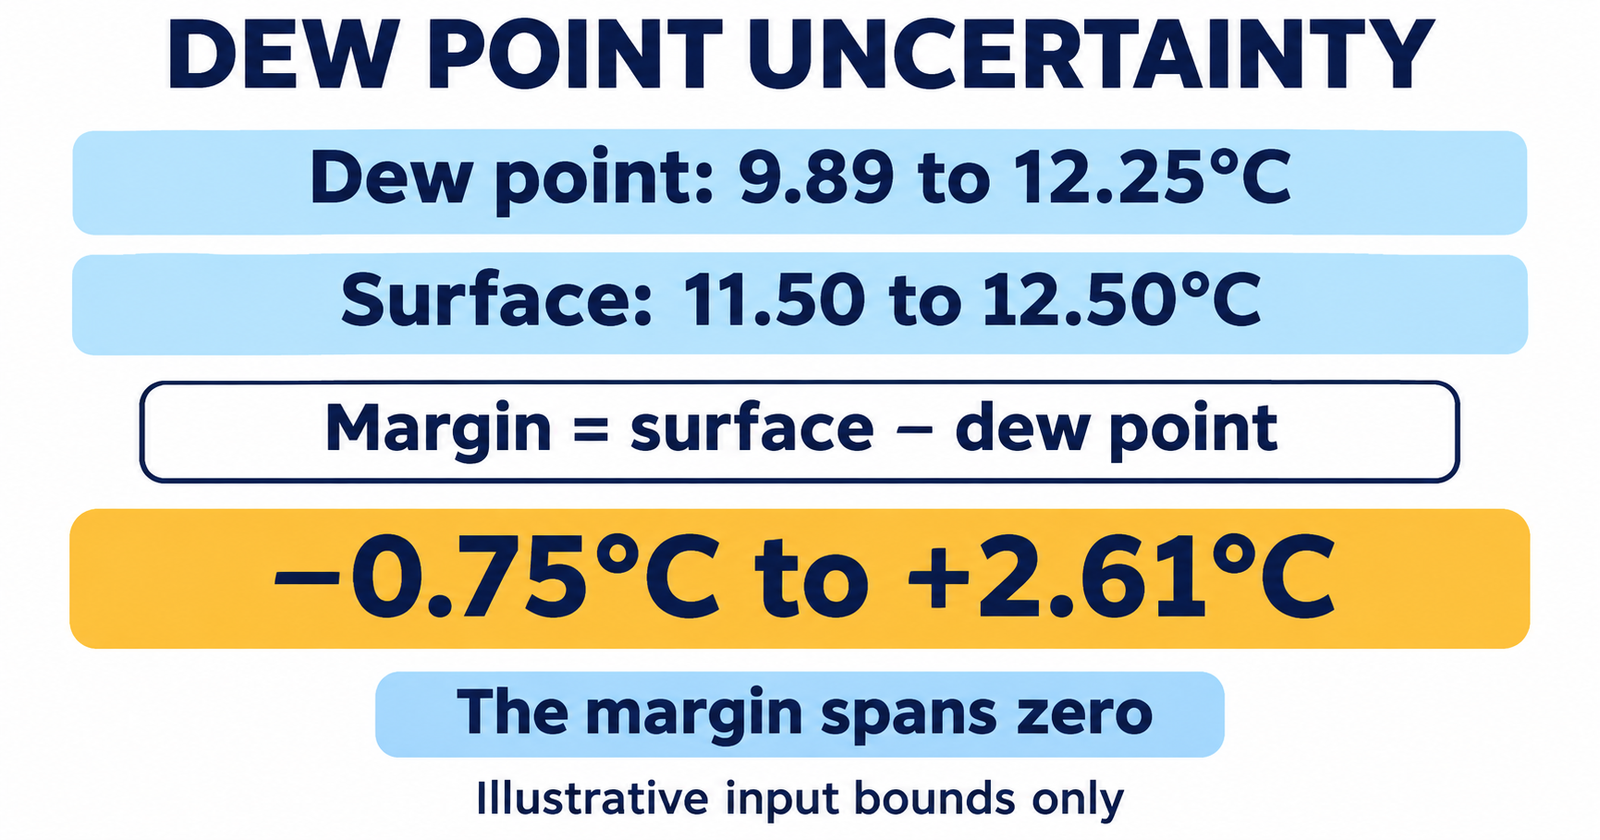
The surface itself spans 11.50°C to 12.50°C. The lowest margin pairs the lowest surface temperature with the highest dew point: 11.50 − 12.2544 = −0.7544°C. The highest margin pairs the highest surface temperature with the lowest dew point: 12.50 − 9.8907 = +2.6093°C.
The resulting margin interval is −0.75°C to +2.61°C. Its sign is unresolved even though the point estimate is positive. This is a statement about the input combinations allowed by the example, not proof that the cold pipe is wet.
Separate bounding from probability
The rectangular input box allows each input to vary anywhere inside its stated range. Taking its extreme corners does not require statistical independence. It does allow simultaneous extremes, so the interval can be conservative if additional information rules those combinations out.
For example, two readings might share a calibration influence. If that relationship is known and justified, a joint model may produce a different bound. Do not simply assume errors cancel because the resulting margin looks more convenient.
A Monte Carlo simulation would require probability distributions and an account of dependence between inputs. Uniform sampling inside these ranges would be an additional modelling choice, not something implied by the bounds. The fraction of simulated cases below zero should not be presented as a measured failure probability without that supporting model.
Report three possible outcomes
If the complete interval is positive, every allowed combination keeps the surface above the computed dew point. If the complete interval is negative, every allowed combination places it below. If zero is inside the interval, the stated measurements do not resolve the sign of the margin.
Our example is in the third category. A dashboard can display “margin spans zero” with the nominal value and interval beside it. That label is more informative than turning a green indicator on whenever a rounded point estimate exceeds zero.
An operational controller would also need a required margin, response time, hysteresis and a defined action. Those settings depend on the equipment and measurement process; this arithmetic example does not choose them. Keep the physical zero threshold distinct from a larger operating margin specified for a particular installation.
Improve the inputs that drive the result
First check location and timing. Air measured at a return grille may not match the air next to the pipe. A rapidly cooling surface and a slow humidity sensor can produce a pair of readings that never represented the same physical state.
Next check the surface measurement. Contact quality, the sensor mounting method and, for infrared instruments, surface emissivity and reflections can affect what the displayed temperature represents. A more detailed formula cannot repair a reading taken from the wrong surface.
Finally document the calculation basis. Keep units, coefficients, raw readings, time stamps and bounds with the reported result. Retain unrounded numbers internally so that formatting does not change an alert state. Do not add decimal places to suggest an accuracy the inputs cannot support.
This interval includes only the three assumed input bounds. It does not include a quantified allowance for the Magnus approximation, spatial variation, unmodelled drift or dynamic response. Those omissions matter if the result is used beyond this worked example, especially near a decision threshold.
Make the result auditable
A useful record for this example contains the nominal dew point of 11.09°C, the dew-point range of 9.89°C to 12.25°C, the surface range of 11.50°C to 12.50°C, and the resulting margin range of −0.75°C to +2.61°C. State that the humidity tolerance is in percentage points and that the example assumes room air at approximately atmospheric pressure.
The arithmetic is small enough to reproduce by hand or in a short function. The more consequential decision is what the inputs mean. Preserve that meaning alongside the number, and the next engineer can distinguish a calculated value from a defensible measurement conclusion.
ALT: Dew point uncertainty worksheet showing a calculated dew-point range of 9.89–12.25°C and a surface-temperature range of 11.50–12.50°C. Subtracting the bounds gives a surface margin from minus 0.75°C to plus 2.61°C, spanning zero.
КОНЕЦ ПУБЛИКАЦИИ. ALT вставлять в описание изображения, не в тело статьи.
ТЗ КАРТИНКИ Файл: dew-point-uncertainty-surface-margin-2026-hashnode.png Размер: 1600 × 840, PNG Место: обложка статьи Стиль: Белый фон, тёмно-синяя типографика, голубые карточки, янтарный итог; аккуратная техническая инфографика. Композиция: Две строки входных диапазонов, под ними формула вычитания границ и крупный диапазон результата. Никаких непроверенных осей или графиков. Текст в изображении: DEW POINT UNCERTAINTY Dew point: 9.89 to 12.25°C Surface: 11.50 to 12.50°C Margin = surface − dew point −0.75°C to +2.61°C The margin spans zero Illustrative input bounds only
Промпт ImageGen: Use case: infographic-diagram. Create one finished professional editorial infographic. Asset: CalcEngineer Hashnode for 12 November 2026. Landscape 1600x840, exact aspect ratio. Style: Белый фон, тёмно-синяя типографика, голубые карточки, янтарный итог; аккуратная техническая инфографика. Composition: Две строки входных диапазонов, под ними формула вычитания границ и крупный диапазон результата. Никаких непроверенных осей или графиков. Render ONLY the following English text, verbatim, with clear hierarchy and correct mathematical signs: "DEW POINT UNCERTAINTY" "Dew point: 9.89 to 12.25°C" "Surface: 11.50 to 12.50°C" "Margin = surface − dew point" "−0.75°C to +2.61°C" "The margin spans zero" "Illustrative input bounds only" Use a clean modern sans-serif. Keep every label and number readable at feed size, with at least 6% safe margins. Accurate units and signs. No additional text, logos, URLs, watermark, people, houses, coins, computers or decorative machinery. This is a numerical educational diagram. Opaque background.
About the author
- Civil & Mechanical Engineer. Building free engineering calculators at calcengineer.com — HVAC, electrical, structural and more. 600+ calculators in progress.
Comments
Join the discussionNo comments yet. Be the first to comment.